
Some dates in market history are quiet. November 17 is not one of them — at least, not every year. Here is what the S&P 500 (^GSPC) did on this exact calendar date, in every year we have data for.
The best November 17s
- November 17, 1997: +1.9%
- November 17, 1982: +1.9%
- November 17, 1931: +1.6%
The worst November 17s
- November 17, 2008: -2.6%
- November 17, 1930: -2.4%
- November 17, 2011: -1.7%
The lesson is the same one this blog keeps finding: a single date tells you nothing about the next year. The market’s best and worst days often sit a few years apart on the same square of the calendar.
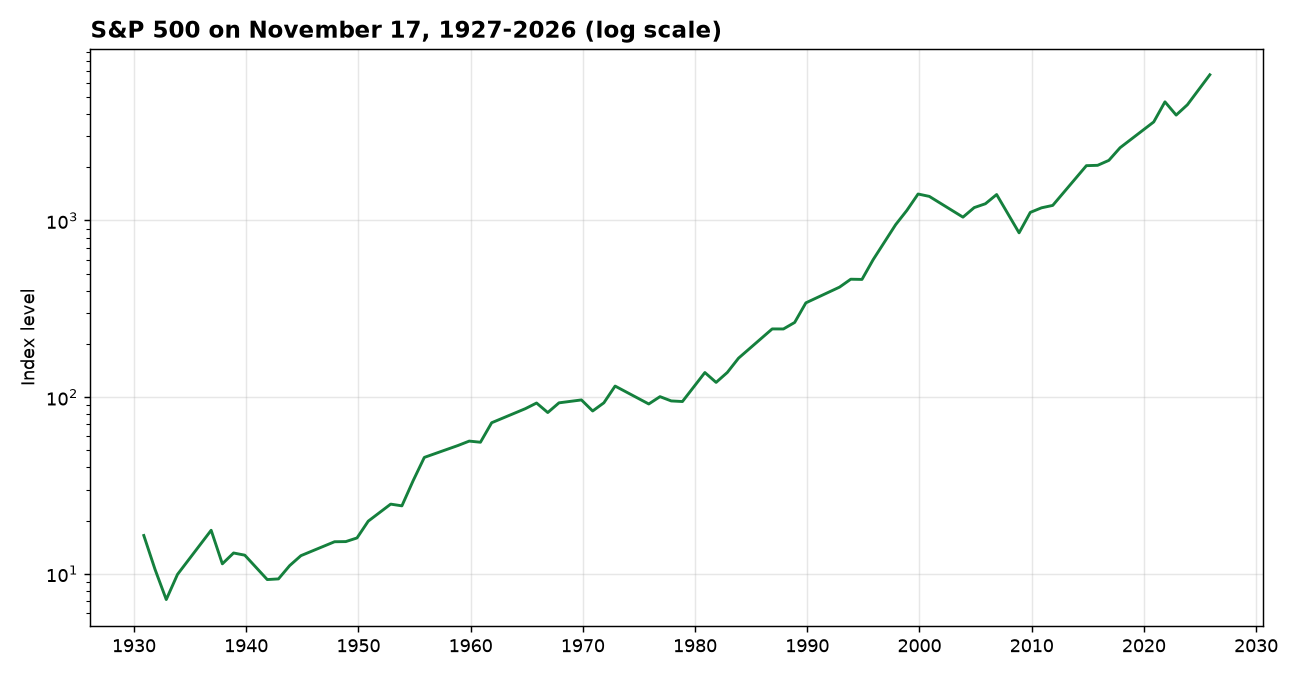
How we got the numbers. Annual S&P 500 total returns (dividends reinvested) are from History of Market‘s annual total-return series (historyofmarket.com, CC BY 4.0, updated November 14, 2026; 2026 is year-to-date through November 13). We cross-checked it against in2013dollars.com: $100 in the S&P 500 at the start of 1970 becomes $39,357.95 by the end of 2026 there; this series gives $39,413 — 0.14% apart. Price paths are from our own daily S&P 500 price history (1927–2026). All dollar figures are nominal — they are not adjusted for inflation. Past performance does not predict future returns. This article is financial history, not investment advice.