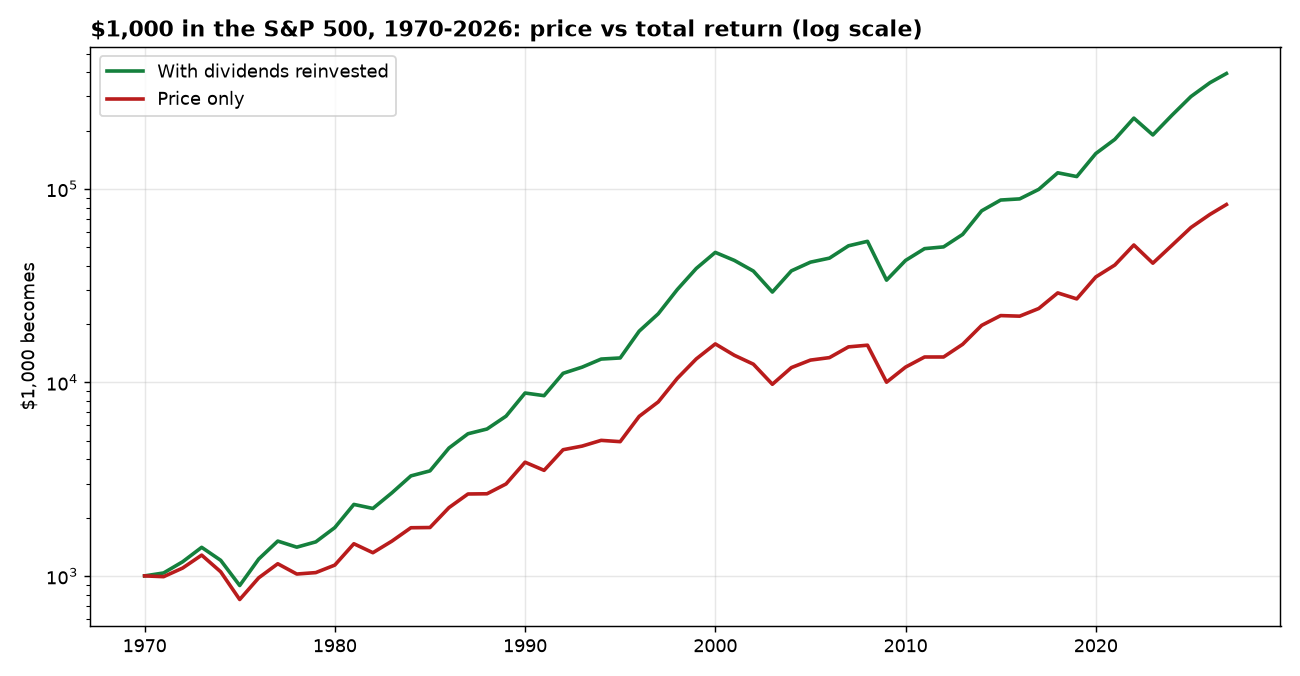
Look at a chart of the S&P 500 (^GSPC) and you see the price. Look at your brokerage account and you see something else — because the chart leaves out the dividends. Since 1970, the difference is most of the money.
$394,130
What $1,000 in the S&P 500 in 1970 became with dividends reinvested — vs $82,931 on price alone
The price alone turned $1,000 into about $82,931. Reinvesting the dividends turned it into $394,130. The dividends contributed roughly $311,199 — about 79% of the final value. A price chart shows you less than a quarter of the story.
$1,000 in the S&P 500 from 1970: price-only vs dividends reinvested (log scale). Data: History of Market annual total returns; our daily S&P 500 price history.
A 2% dividend yield sounds like nothing. Compounded for 56 years, it is the difference between $82,931 and $394,130. The yield was much higher in the 1970s and 1980s (3–5%), which is why the gap opened widest exactly when prices were going nowhere. Dividends are the shock absorber that price charts never show — and the engine that does most of the compounding.
How we got the numbers. Annual S&P 500 total returns (dividends reinvested) are from History of Market‘s annual total-return series (historyofmarket.com, CC BY 4.0, updated November 14, 2026; 2026 is year-to-date through November 13). We cross-checked it against in2013dollars.com: $100 in the S&P 500 at the start of 1970 becomes $39,357.95 by the end of 2026 there; this series gives $39,413 — 0.14% apart. Price paths are from our own daily S&P 500 price history (1927–2026). All dollar figures are nominal — they are not adjusted for inflation. Past performance does not predict future returns. This article is financial history, not investment advice.