Skip to content
Ticker Tales

Ticker Tales

  • Home
  • About
  • Privacy Policy
  • Disclaimer
  • If You’d Invested
  • Market History
  • English
    • English
    • 한국어
    • Français
    • Deutsch
    • 中文

Market History

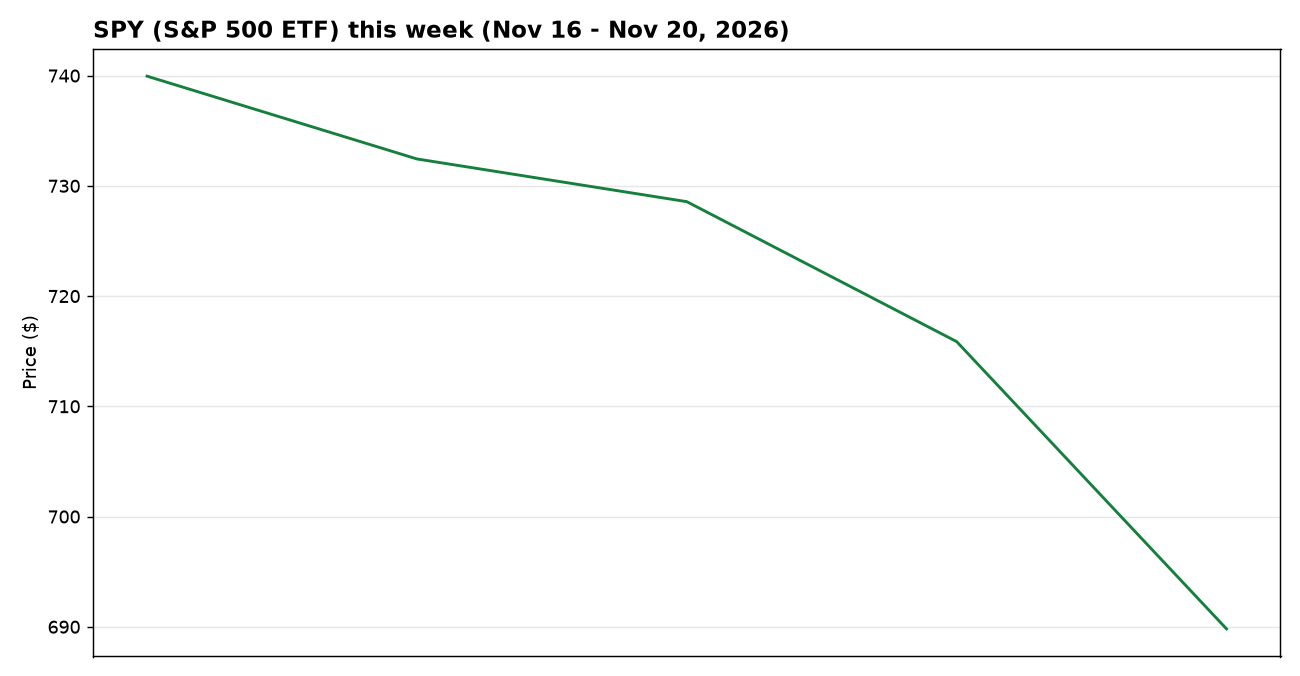
The Week in Numbers: S&P 500 -6.8% (November 16–November 20, 2026)

November 22, 2026 by papagong
SPY this week

S&P 500 -6.8% this week, year to date -11.3%, and the week’s biggest movers.

Categories Market History

What Dividends Really Did: The $311,199 That Price Charts Never Show (1970–2026)

November 21, 2026 by papagong
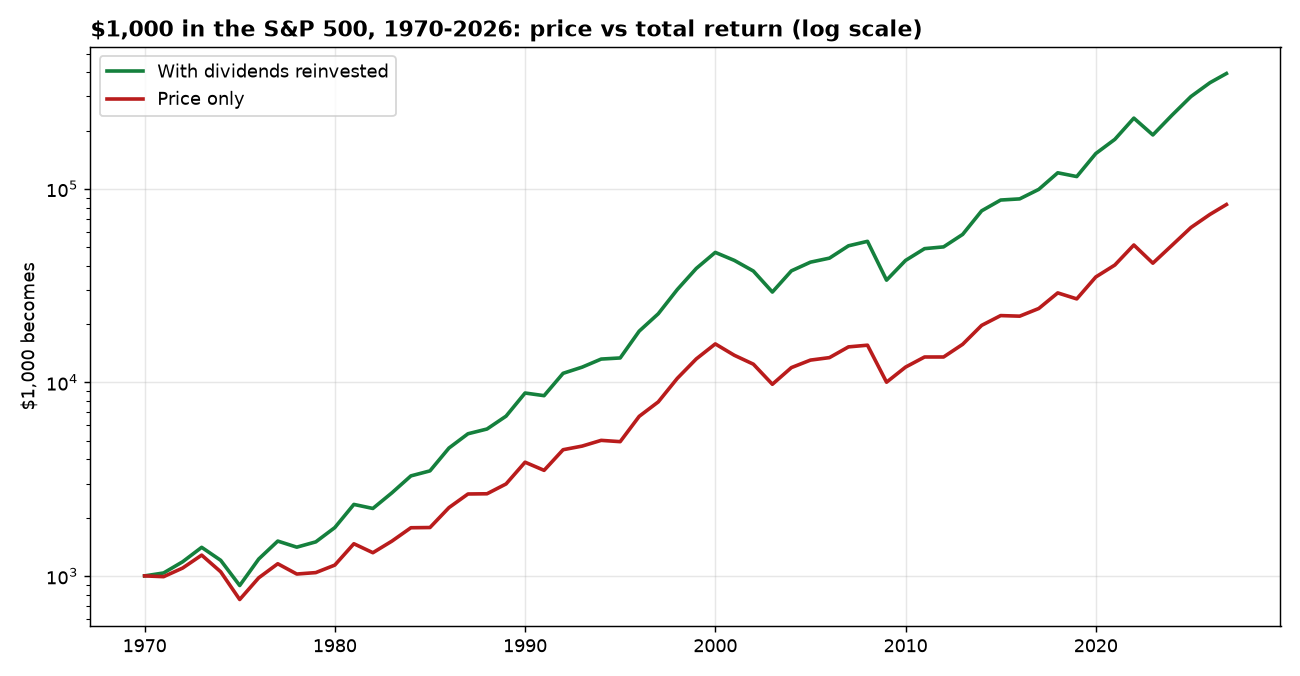
Price vs total return 1970-2026

The S&P 500 price turned $1,000 into about $82,931 since 1970. With dividends reinvested it became about $394,130. The gap is the story.

Categories Market History

Information Technology in the S&P 500: From 5% to 29% (1980–2024)

November 20, 2026 by papagong
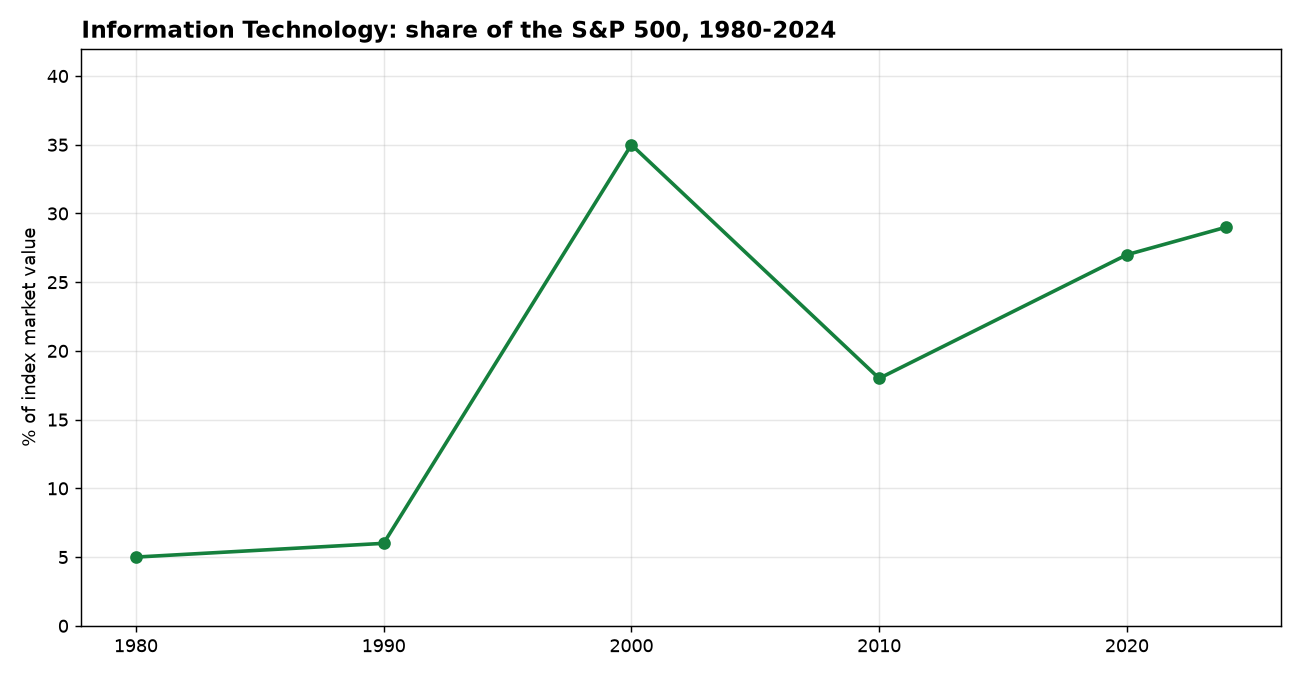
Information Technology share of the S&P 500 1980-2024

Information Technology was about 5% of the S&P 500 in 1980 and about 29% in 2024. The 44-year arc, the peak, and what it means.

Categories Market History

1987: Black Monday: How Far the Market Fell, and How Long It Took to Come Back

November 19, 2026 by papagong
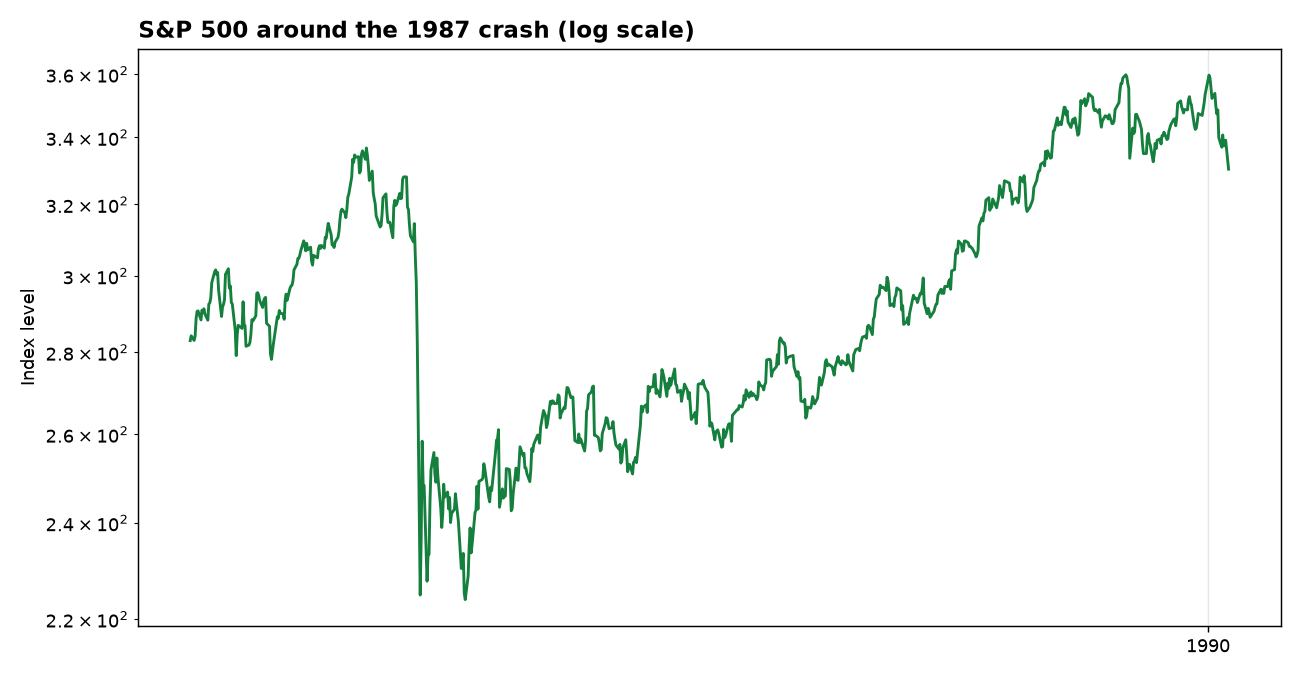
S&P 500 around the crash

The S&P 500 fell -33.5% in the 1987 crash. Here is how far it fell, and how long the way back took.

Categories Market History

NVIDIA (NVDA): 27 Years of Stock Market History in One Chart

November 18, 2026 by papagong
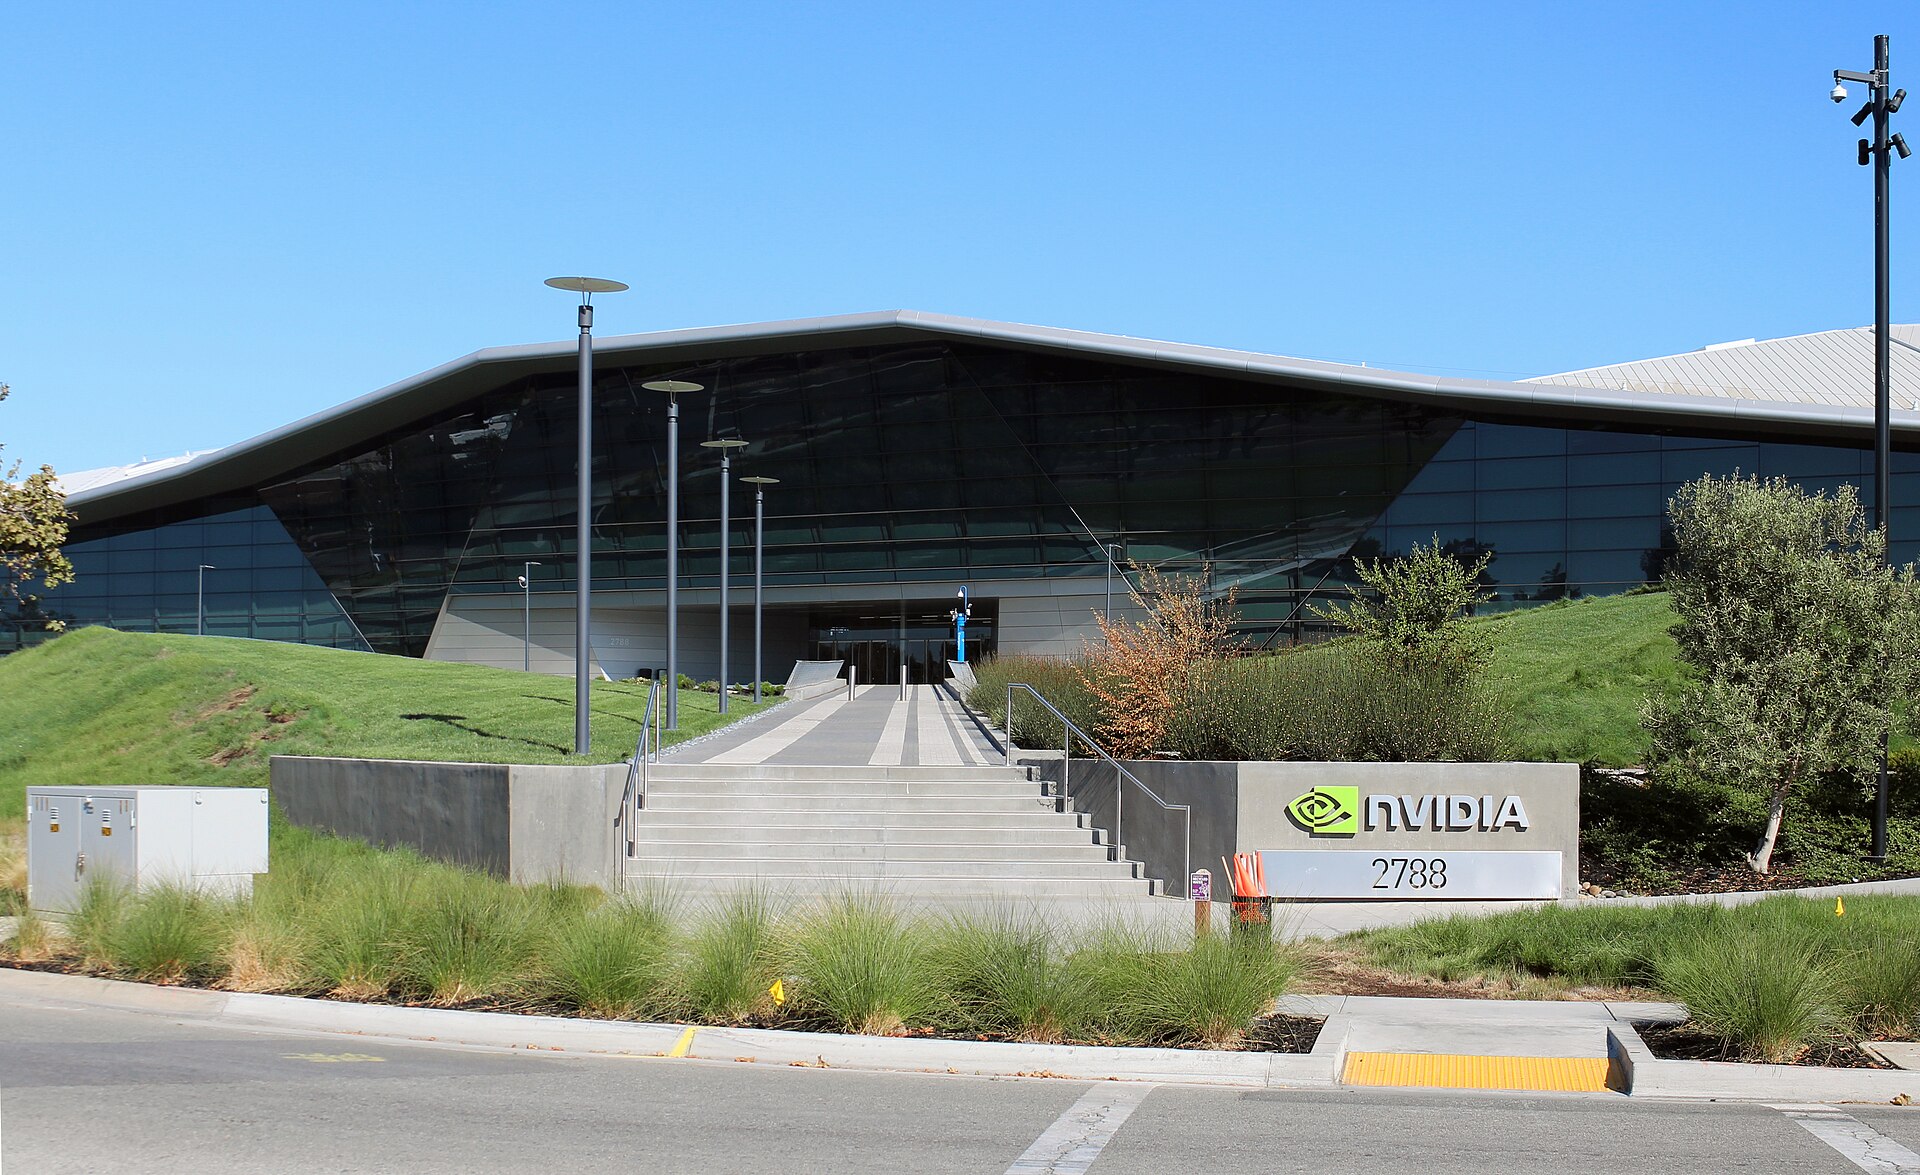
NVIDIA (NVDA)

NVIDIA (NVDA) is the chipmaker that went from video games to the center of the AI boom. 27 years of price history, the worst crash, and the decade-by-decade story.

Categories Market History

On This Day in Market History: November 17

November 17, 2026November 17, 2026 by papagong
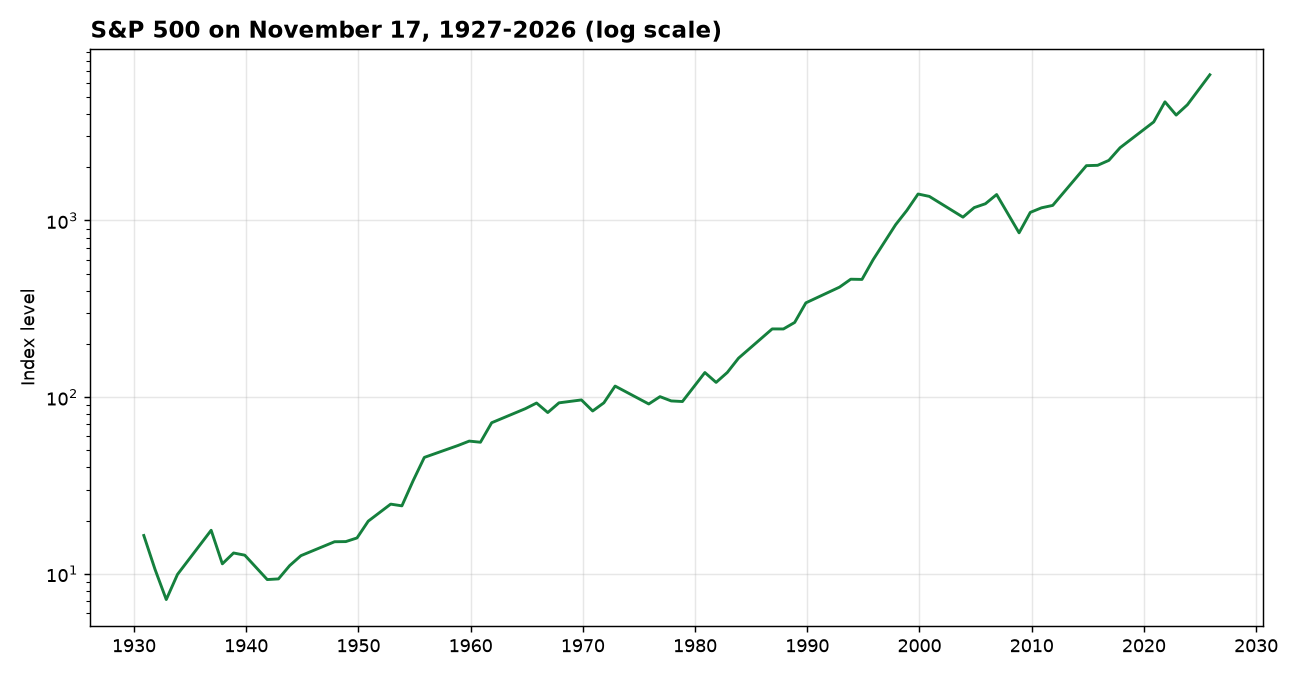
S&P 500 on this date across history

What did the S&P 500 do on November 17? The best and worst versions of this date, from 1927 to 2026.

Categories Market History

Who Runs the Market? How Energy Lost the Crown to Technology (1980–2024)

November 17, 2026November 16, 2026 by papagong
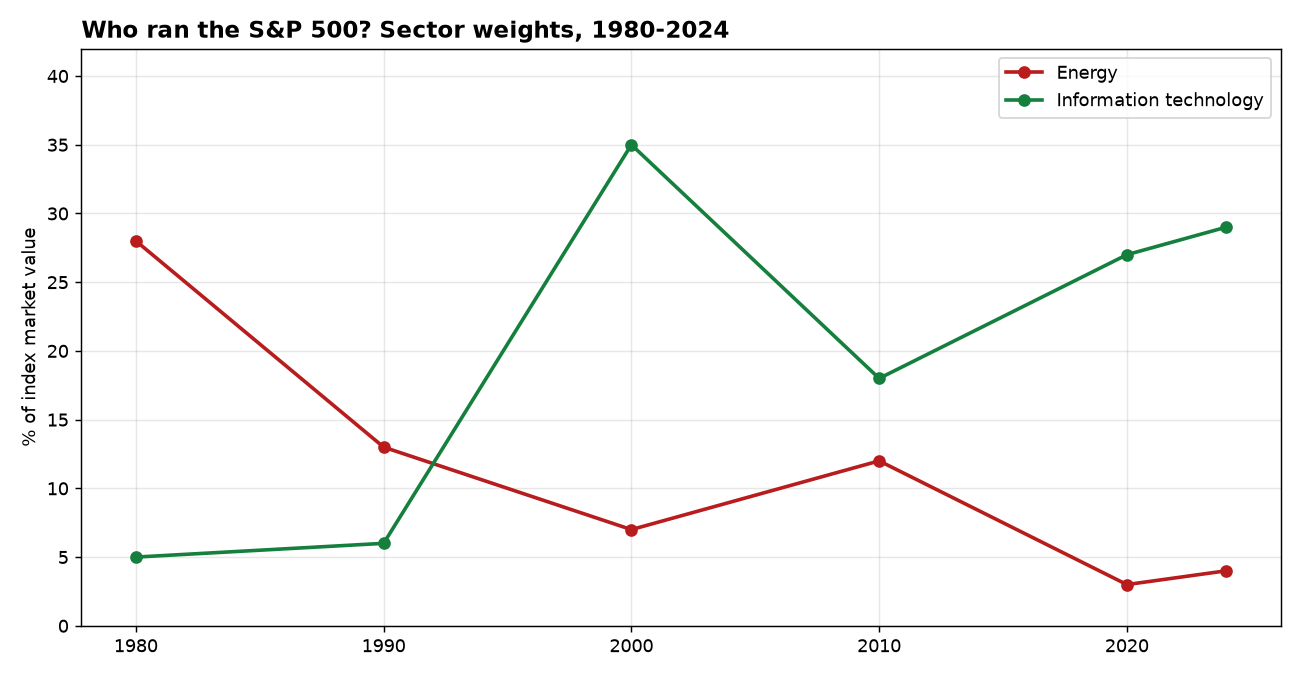
Sector weights 1980-2024

In 1980 energy was 28% of the S&P 500. By 2024 it was about 4%, and technology was about 29% — and nearly 40% by 2026. The story of the handover.

Categories Market History

1973-74: the Nifty Fifty crash: How Far the Market Fell, and How Long It Took to Come Back

November 17, 2026November 16, 2026 by papagong
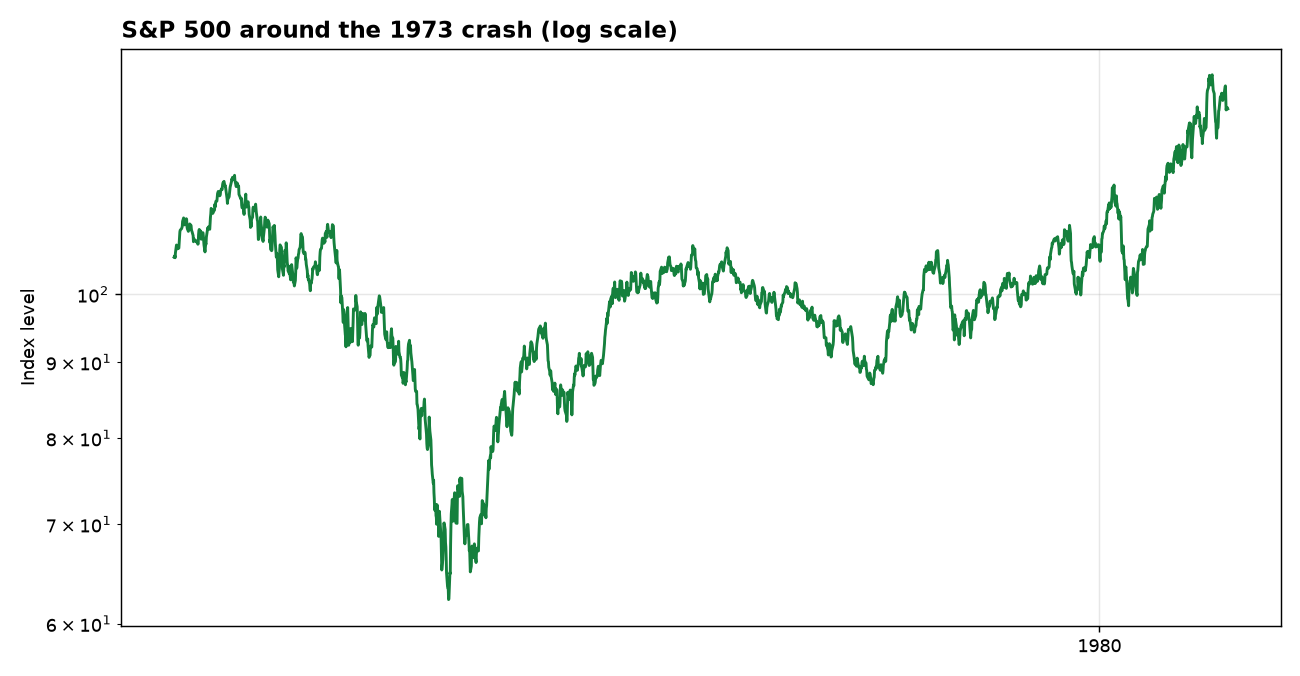
S&P 500 index around the 1973-74 crash

The S&P 500 fell -48.2% in the 1973 crash. Here is how far it fell, and how long the way back took.

Categories Market History

Microsoft (MSFT): 40 Years of Stock Market History in One Chart

November 17, 2026November 16, 2026 by papagong
Microsoft headquarters campus in Redmond, seen from the air

Microsoft (MSFT) is the quiet compounder that survived three tech crashes. 40 years of price history, the worst crash, and the decade-by-decade story.

Categories Market History

5 Lessons from 60 Years of Stock Market Data (1962–2026)

November 17, 2026November 16, 2026 by papagong
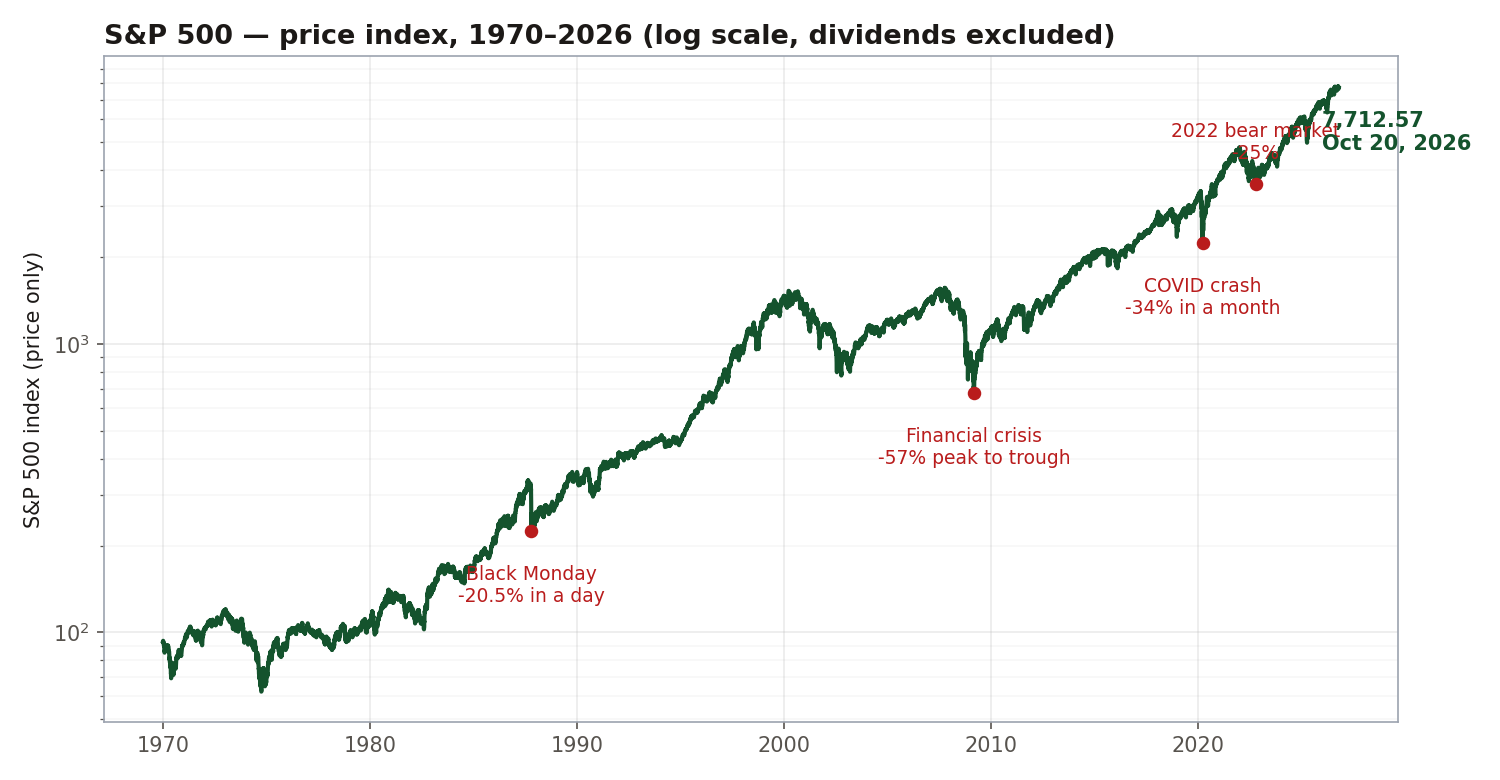
S&P 500 price index 1970-2026, log scale, with crashes marked

We analyzed every trading day of the U.S. stock market from 1962 to 2026 — 11.8 million daily prices. Five lessons kept showing up, and the first one is the most important.

Categories Market History

Recent Posts

  • The Week in Numbers: S&P 500 -6.8% (November 16–November 20, 2026)
  • If You’d Invested $1,000 in the S&P 500 in 1977, Here’s What It Would Be Worth Today
  • What Dividends Really Did: The $311,199 That Price Charts Never Show (1970–2026)
  • If You’d Invested $1,000 in the S&P 500 in 1976, Here’s What It Would Be Worth Today
  • Information Technology in the S&P 500: From 5% to 29% (1980–2024)

Recent Comments

No comments to show.
© 2026 Ticker Tales • Built with GeneratePress