
Information Technology has been about 29% of the S&P 500 (^GSPC) in 2024 — but that number has moved a lot over the decades. In 1980 it was about 5%. Its highest point in the years we track was about 35% in 2000.
The peak
Its peak so far came in 2000, at about 35% of the index — then it collapsed to around 15% by 2002 as the dot-com bubble burst.
What the arc says
Technology is the only sector that has held the crown twice: at the dot-com peak and again today. The difference is what sits underneath the weight — in 2000 it was unprofitable startups, in the 2020s it is the most profitable companies on earth. The 2018 GICS reclassification moved Alphabet, Facebook (now Meta), and Netflix out of Technology into the new Communication Services sector, cutting the reported Technology weight by roughly 5–6 points overnight — no companies changed, only the labels.
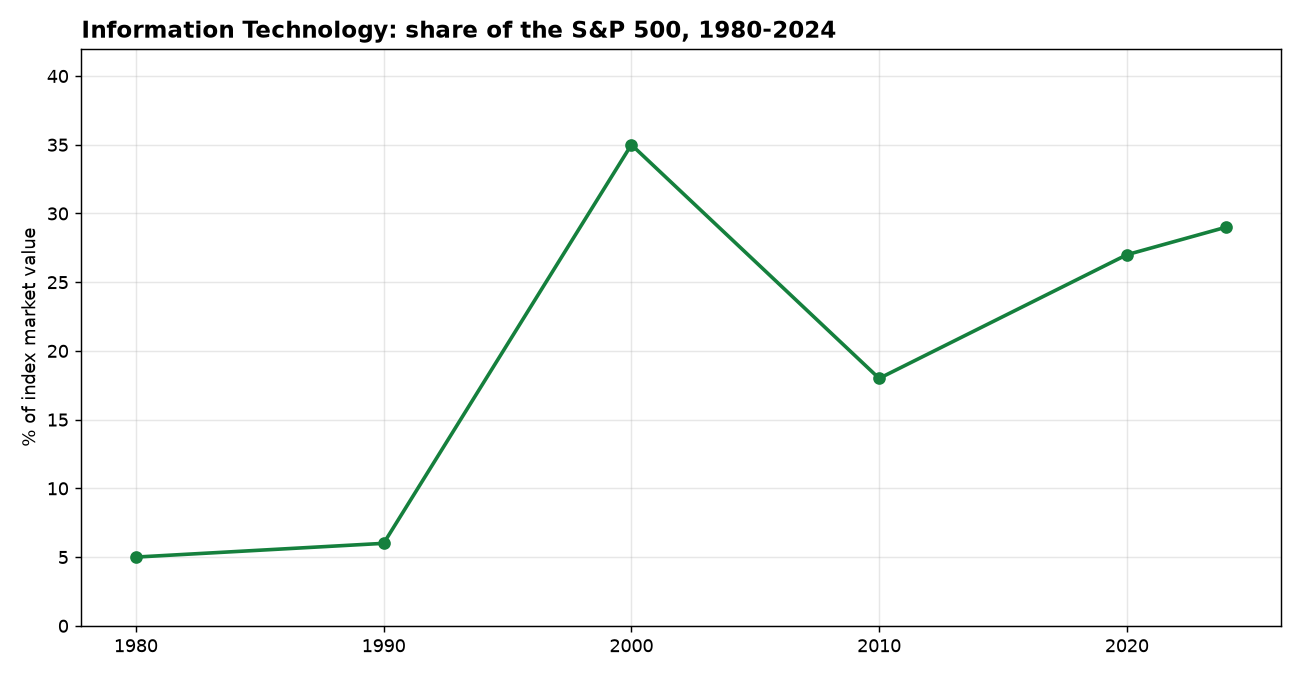
The numbers
| Year | Share of the S&P 500 |
|---|---|
| 1980 | about 5% |
| 1990 | about 6% |
| 2000 | about 35% |
| 2010 | about 18% |
| 2020 | about 27% |
| 2024 | about 29% |
No sector has held the top weight forever. The index is a mirror of the economy, and the mirror gets re-silvered every decade — which is why this blog’s sector series keeps coming back to the same lesson: the winners of one era are rarely the winners of the next.