
In January 1976, $1,000 was serious money — about two months of the average American wage. If you had put it into the S&P 500 (^GSPC) that month and then done absolutely nothing — no trading, no timing, no panic-selling — here is what would have happened.
That is a total return of 322.5x, or about 12.0% a year for 51 years. The number assumes every dividend was reinvested. It is not a typo — it is what happens when compounding gets half a century to work.
Decade by decade
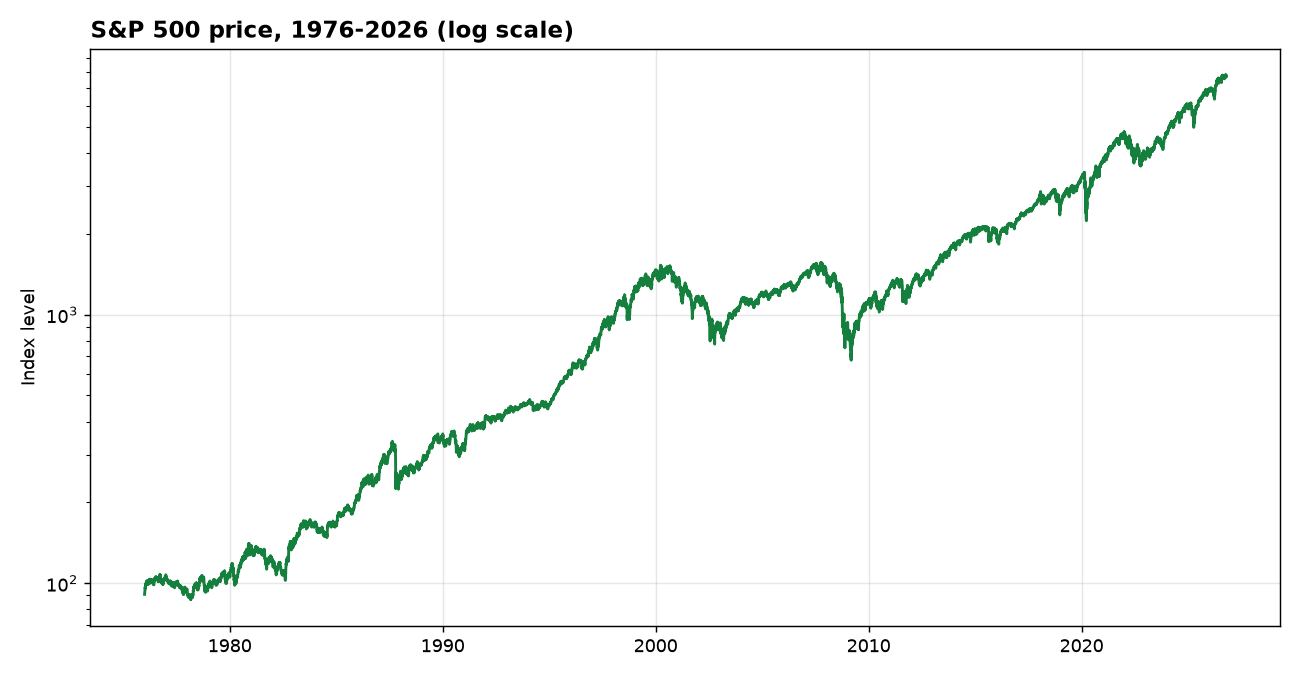
The road to $322,527 was anything but smooth. Here is what $1,000 became at the start of each decade — with dividends reinvested, and on price alone:
| Year | With dividends reinvested | Price only |
|---|---|---|
| 1976 | $1,000 | $1,000 |
| 1980 | $1,454 | $1,163 |
| 1990 | $7,209 | $3,957 |
| 2000 | $38,409 | $16,163 |
| 2010 | $34,907 | $12,267 |
| 2020 | $124,495 | $35,840 |
| Nov 2026 | $322,527 | $84,847 |
The two columns tell different stories. The price column is what a chart shows you. The total-return column is what your account would actually have held. The gap between them is the dividends — the quiet part of the return that never makes headlines.
The best and worst years
Inside those 55 calendar years, the single best year was 1995 (+37.6% total return) and the single worst was 2008 (-37.0%). The worst year is the one that tests whether you actually hold. The best year is the one that rewards you for having held through the worst.
What this means — and what it does not
This is not a claim that the next 55 years will look like the last 55. It is a measurement of what did happen: a diversified basket of American businesses, held without interruption, compounded at about 12.0% a year. The mechanism was not cleverness. It was time, dividends, and not selling.