
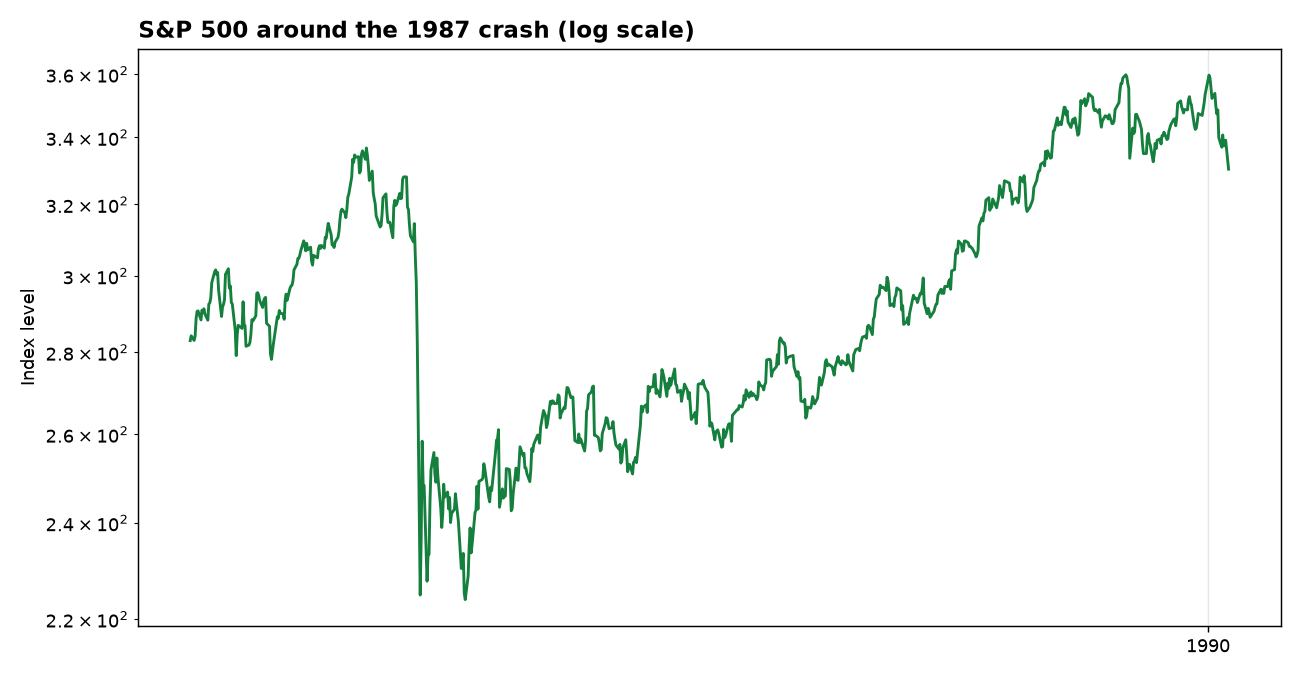
1987: Black Monday. The S&P 500 (^GSPC) peaked at 337 on August 25, 1987 and bottomed at 224 on December 04, 1987 — a fall of -33.5% in 3 months.
-33.5%
Peak to trough, 1987: Black Monday
Then came the slow part: and it took 20 more months to climb back to the old peak (July 1989). The whole round trip — peak, trough, back to the peak — is the real cost of a bear market. It is measured in years, not in the percentage on the day of the fall.
What the crash teaches
Every crash in this series looks different in its cause and identical in its shape: a fast fall, a slow recovery, and a market that eventually makes new highs. The investors who were hurt worst were not the ones who held through it — they were the ones who sold at the bottom and never came back.
How we got the numbers. Annual S&P 500 total returns (dividends reinvested) are from History of Market‘s annual total-return series (historyofmarket.com, CC BY 4.0, updated November 14, 2026; 2026 is year-to-date through November 13). We cross-checked it against in2013dollars.com: $100 in the S&P 500 at the start of 1970 becomes $39,357.95 by the end of 2026 there; this series gives $39,413 — 0.14% apart. Price paths are from our own daily S&P 500 price history (1927–2026). All dollar figures are nominal — they are not adjusted for inflation. Past performance does not predict future returns. This article is financial history, not investment advice.