
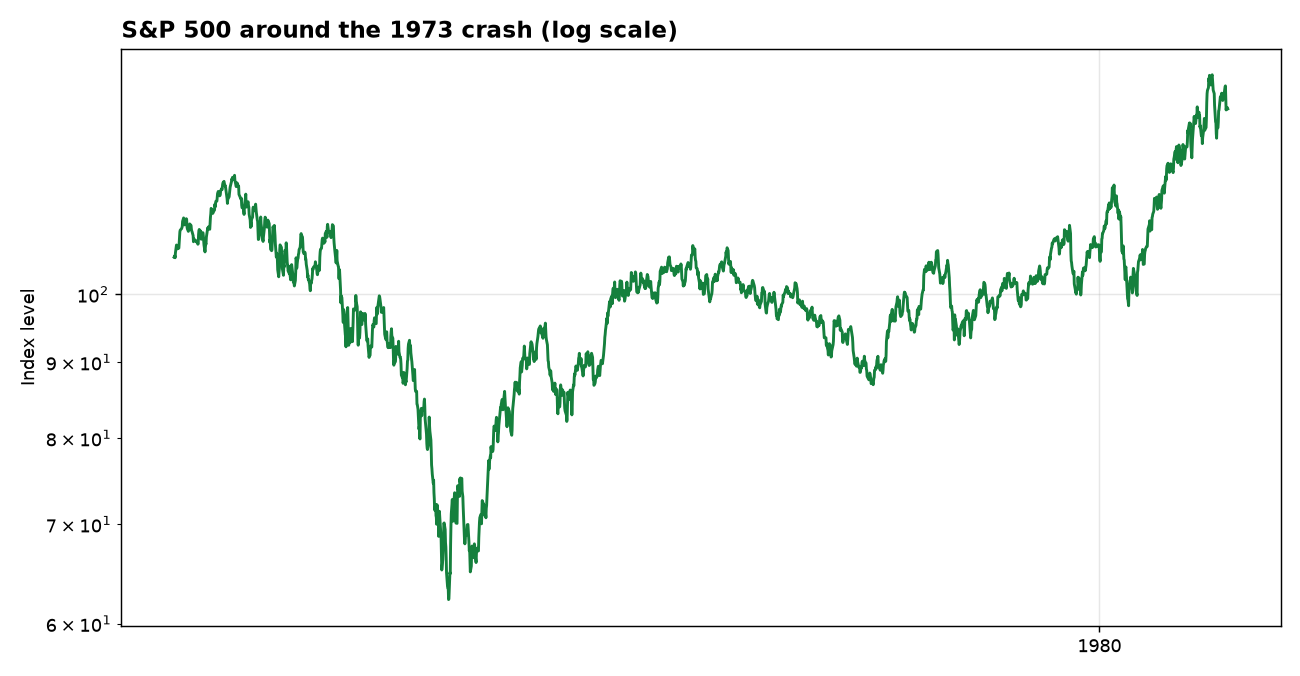
1973-74: the Nifty Fifty crash. The S&P 500 (^GSPC) peaked at 120 on January 11, 1973 and bottomed at 62 on October 03, 1974 — a fall of -48.2% in 21 months.
Then came the slow part: and it took 69 more months to climb back to the old peak (July 1980). The whole round trip — peak, trough, back to the peak — is the real cost of a bear market. It is measured in years, not in the percentage on the day of the fall.
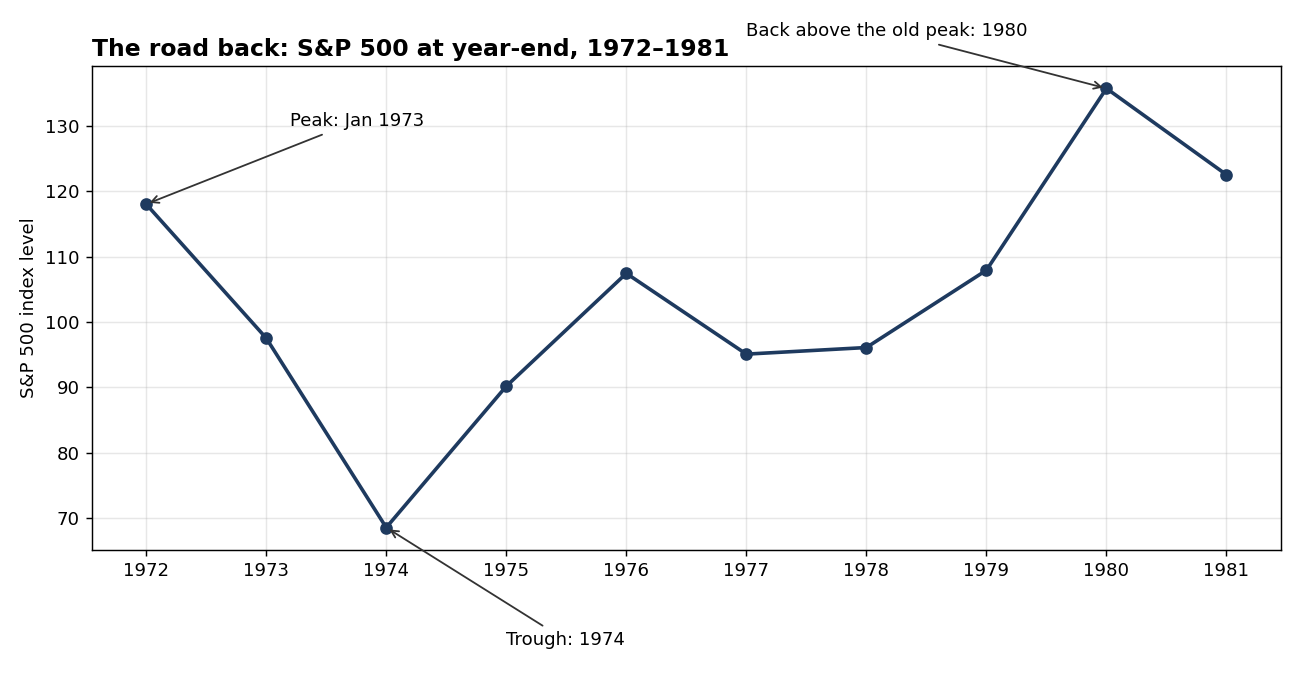
At year-end the index stood at 118 in 1972, fell to 69 by the end of 1974, and did not get back above its old peak until 1980, when it closed the year at 136. The fall took less than two years; the way back took more than five. That asymmetry — fast down, slow up — is the shape of every crash in this series.
What the crash teaches
Every crash in this series looks different in its cause and identical in its shape: a fast fall, a slow recovery, and a market that eventually makes new highs. The investors who were hurt worst were not the ones who held through it — they were the ones who sold at the bottom and never came back.