
In January 1970, Coca-Cola (KO) was already an American institution. The Beatles were still together, a gallon of gas cost 36 cents, and a share of Coca-Cola cost about $82. If you had put $1,000 into KO stock that month and then done absolutely nothing — no trading, no timing, no panic-selling — here is what would have happened.
Watch the video version
We tell this same story on our YouTube channel 그날, 그 선택 — the numbers match this article ($573,439 with dividends reinvested).
That is a total return of 57,244%, or about 11.8% a year for 56 years. The number comes from total-return data that assumes every dividend was reinvested. It is not a typo. A boring soda company turned $1,000 into more than half a million dollars.
The twist: Coca-Cola beat the index
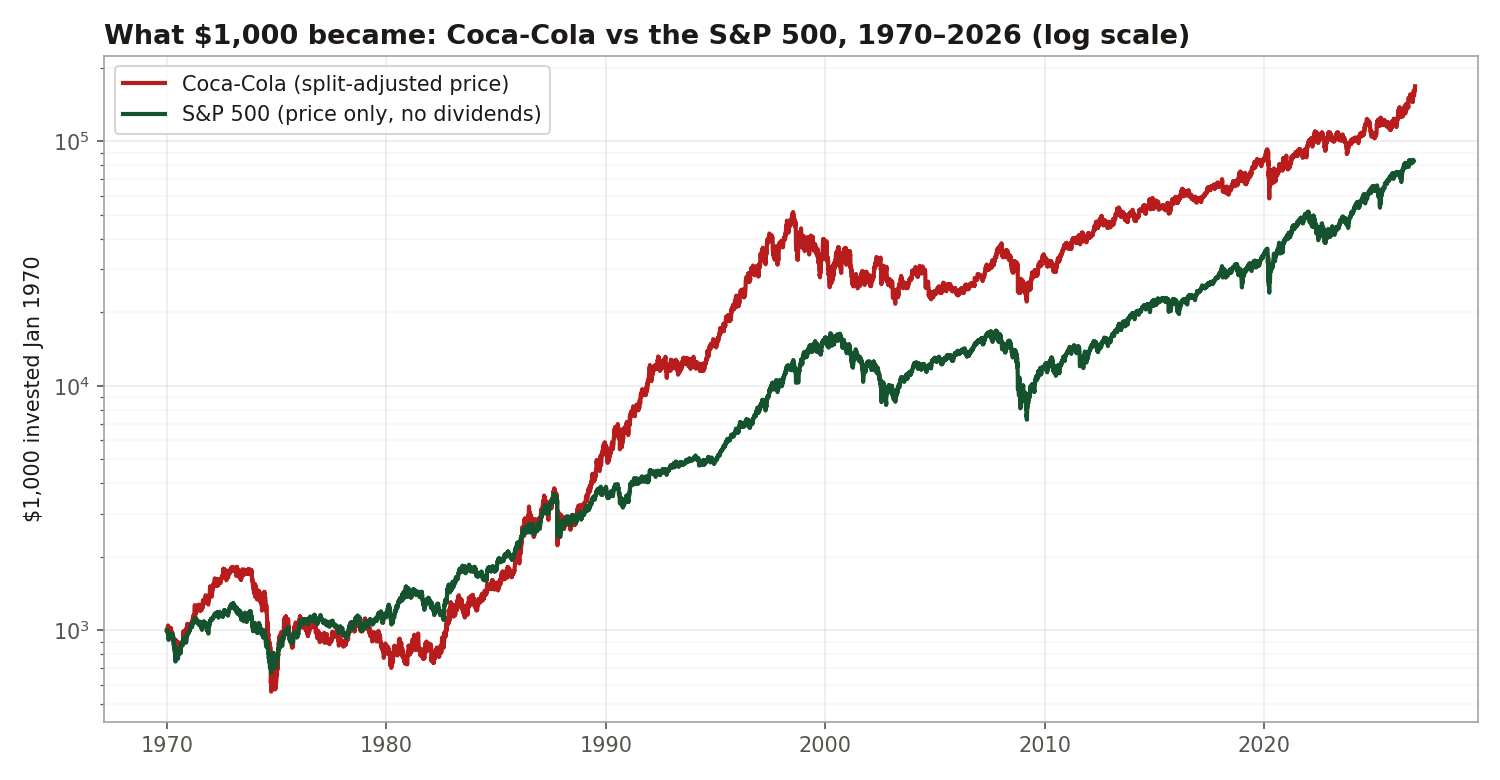
Here is the part most people get wrong about this story. The same $1,000 in the S&P 500 at the start of 1970 — also with dividends reinvested — would be worth about $393,580 by the end of 2026. Coca-Cola beat the plain index by roughly $180,000 on the same $1,000.
That does not make stock-picking easy. Coca-Cola is one of the rare exceptions — a wonderful business that kept compounding for half a century. Most individual stocks lag the index badly. But this one did not, and that is exactly why the story is worth telling carefully, with the real numbers.
Decade by decade
The road to $573,439 was anything but smooth. Here is what $1,000 became at the start of each decade — with dividends reinvested, and on price alone:
| Year | With dividends reinvested | Price only |
|---|---|---|
| 1970 | $1,000 | $1,000 |
| 1980 | $1,106 | $837 |
| 1990 | $11,638 | $5,616 |
| 2000 | $80,311 | $33,860 |
| 2010 | $98,742 | $33,140 |
| 2020 | $260,941 | $64,360 |
| Nov 2026 | $573,439 | $115,407 |
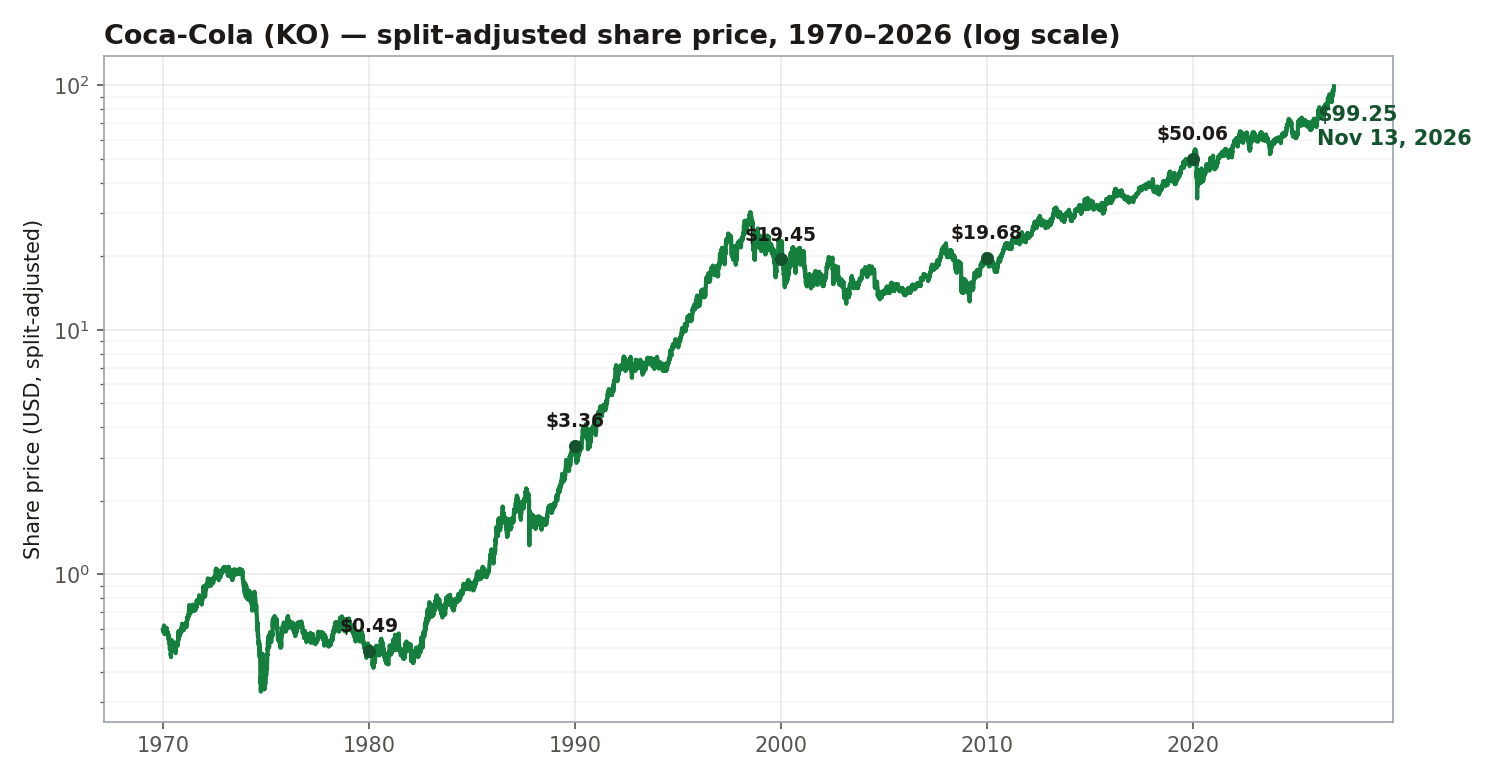
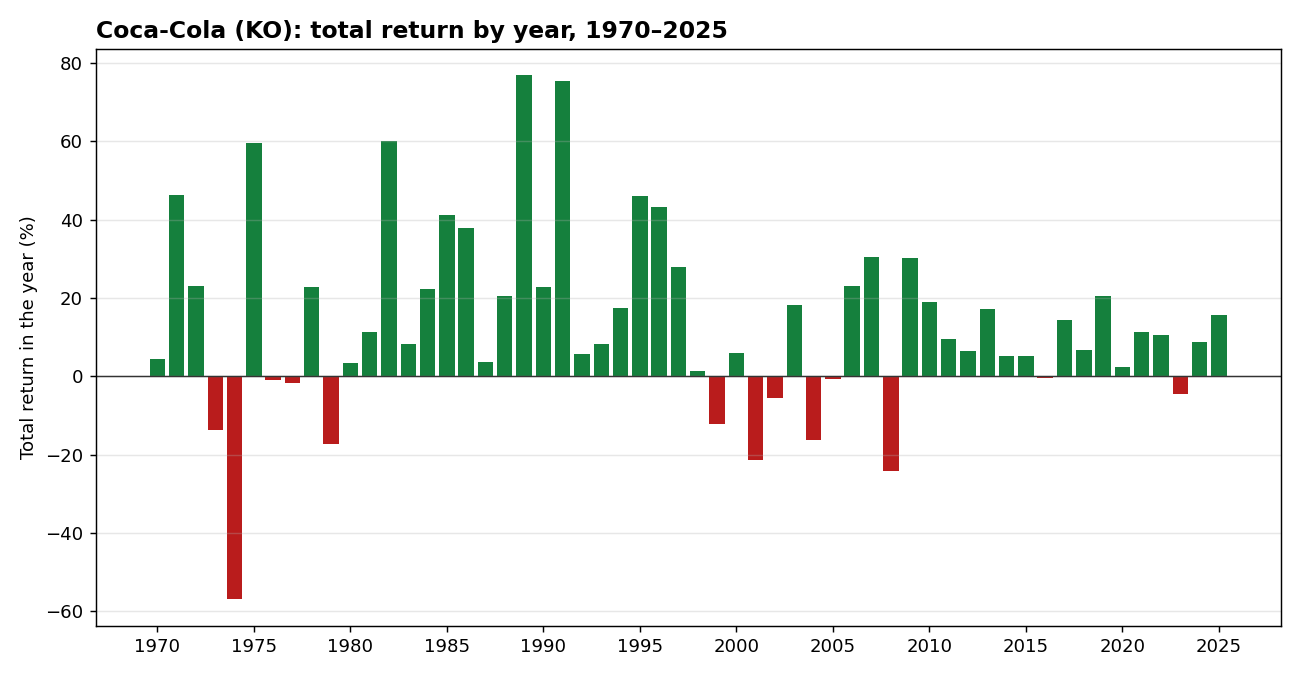
Read that first row again: after ten years, your $1,000 was worth $1,106 with dividends — but only $837 on price alone. The 1970s were brutal for Coca-Cola — the stock fell 69% from early 1973 to October 1974, during the Nifty Fifty crash. Anyone who bought in 1970 and checked back in 1980 would have concluded the whole idea was a mistake.
Then came the 1980s and 1990s. The stock roughly quadrupled in the 1980s and grew almost sixfold in the 1990s. The 2000s gave back almost nothing — $80,311 in 2000 became $98,742 in 2010 with dividends, and on price alone it went backwards ($33,860 to $33,140), a lost decade again. The 2010s and 2020s did the rest.
The story
Coca-Cola (KO) began in May 1886, when Atlanta pharmacist John Stith Pemberton developed the drink and sold it as a patent medicine. In 1889 the formula and brand were sold to Asa Griggs Candler, who incorporated the Coca-Cola Company in Atlanta in 1892 and turned a local soda into a national brand.
The company’s most famous mistake came in April 1985, when it replaced the original formula with “New Coke”. Customers revolted, and 79 days later — on July 11, 1985 — the original formula returned as Coca-Cola Classic. The stock, for the record, still rose 35% that year on price alone: the fiasco hurt the brand’s pride more than its business.
Today the company markets more than 500 drinks and brands across 200 countries. The red can outlived the 1973 crash, the 1987 crash, the 2008 crisis and a pandemic — and the dividend kept coming through all of them.
Where the money really came from: dividends
Here is the part most “if you’d invested” stories skip. The $115,407 in the table above is the price path. The headline $573,439 includes reinvested dividends — and the gap between them is the story.
- Price alone: about $115,000 (the share price, adjusted for six stock splits, rose from about $82 to $99.25).
- With dividends reinvested: $573,439.
- Dividends contributed: roughly $458,000 — about 80% of the final value.
Coca-Cola has raised its dividend for 63 consecutive years, making it one of the longest-running Dividend Kings in the market. Every quarter, the company handed shareholders cash, and shareholders who reinvested it bought more shares, which paid more dividends. Compounding did the quiet work while nobody was watching.
Four crashes survived
Coca-Cola did not glide to $573,439. It fell off cliffs, repeatedly:
| Crash | Peak to trough |
|---|---|
| 1973–74 (Nifty Fifty crash) | −69.1% |
| 1987 (Black Monday) | −41.6% |
| 2008–09 (financial crisis) | −42.3% |
| 2020 (COVID) | −37.0% |
Each time, the business kept selling soda. Each time, the dividend kept arriving. Each time, the price eventually came back — it just took years, and it took an investor willing to hold through the kind of drawdown that makes headlines.
Coca-Cola by the numbers
All figures below are price-only, computed from our daily price data (1970–2025) — dividends excluded, so the true total returns were higher.
- 56 calendar years in the data; the stock rose in 42 of them (75%).
- Best year: 1989, +73% on price alone. Worst year: 1974, −58% — the oil-shock bear market.
- Worst single day: October 19, 1987 (Black Monday), −25%. Best single day: the very next day, October 20, 1987, +20%.
- Even a Dividend King spends a quarter of its years down. The compounding happened anyway.
The CEO
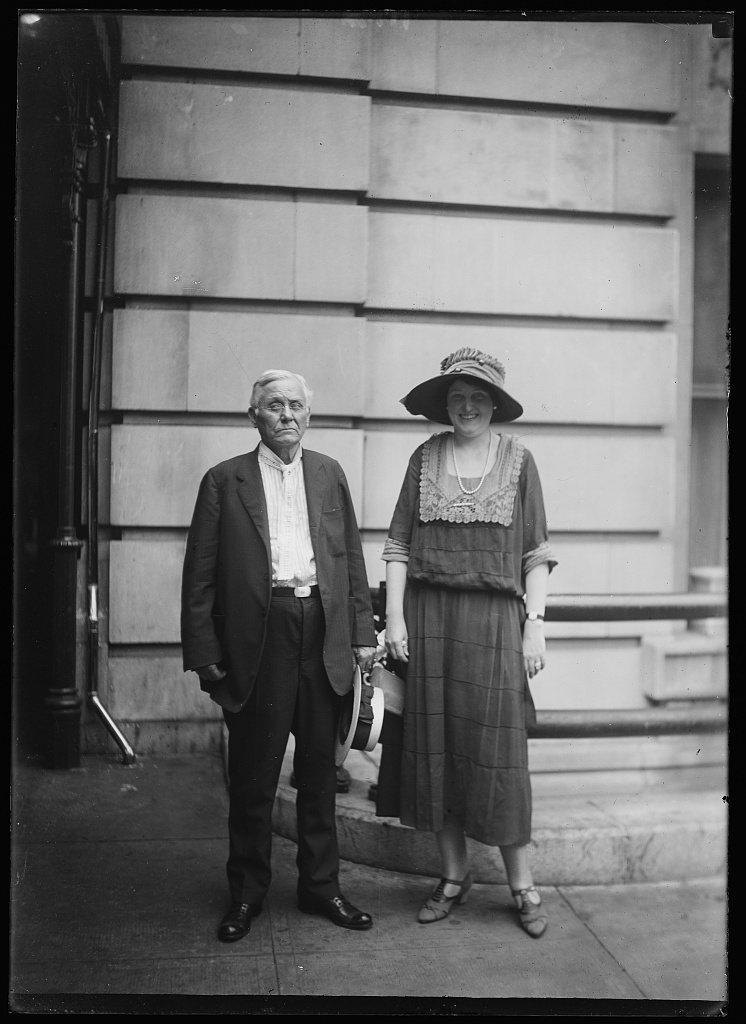
Asa Griggs Candler bought the Coca-Cola recipe from the pharmacist John Stith Pemberton and founded the Coca-Cola Company in Atlanta in 1892. He turned a local soda into a national brand — and later served as mayor of Atlanta, from 1916 to 1919.

Today the company is run by James Quincey. He joined Coca-Cola in 1996, became chief operating officer, then chief executive in 2017 and chairman of the board in 2019.
The products
Coca-Cola is not one drink. Three products built the company.
The original Coca-Cola (1886). Atlanta pharmacist John Stith Pemberton developed the drink and sold it as a patent medicine. It is still the flagship, and still the product the company’s name means.
Diet Coke (1982). Unveiled on July 8, 1982, it was the first new brand since the company’s creation in 1886 to use the Coca-Cola trademark. It is based on a different recipe from the flagship, with a taste of its own — and it became a core product, leading diet-soda sales worldwide for most of its life.
Coca-Cola Zero (2005). Introduced in 2005 as a no-calorie version of the flagship, designed to taste like the original. It was reformulated and renamed Coca-Cola Zero Sugar in 2017.
Who owns it
Nobody owns Coca-Cola outright. It is a public company, and its largest owners are funds — plus one famous individual.
| Largest holders | Shares | Share of the company |
|---|---|---|
| Berkshire Hathaway (Warren Buffett) | 400.0 million | 9.29% |
| Vanguard Group | 370.7 million | 8.61% |
| BlackRock | 313.2 million | 7.28% |
Warren Buffett’s Berkshire Hathaway is the largest single shareholder. Buffett started buying Coca-Cola in 1988, and Berkshire has held a steady 400 million shares since 1994. Together the top three own about a quarter of the company.
Vanguard and BlackRock hold Coca-Cola mostly through index funds: they own it because it is a large weight in the S&P 500, not because a fund manager picked the stock. That is true of most big companies — the biggest owners are, in effect, the index itself.
Source: The Coca-Cola Company’s 2026 proxy statement (SEC filing). Holdings move every quarter as funds buy and sell — this is a snapshot of one moment, not a permanent fact.
So, should you buy Coca-Cola?
That is not what this article is for. The past 56 years say three things, and none of them is a buy recommendation:
- Time did the work, not cleverness. The entire return came from holding one good business for 56 years. There was no trading strategy involved.
- Dividends were about 80% of the outcome. Ignore them and you misunderstand the whole story.
- Even a great company beating the index is the exception, not the rule. Coca-Cola beat the S&P 500 by about $180,000 on the same $1,000 — but it took 56 years and every dividend reinvested. Most individual stocks lag the index, which is why the “just buy the index” argument is still hard to dismiss.
The honest takeaway is not “buy Coke.” It is that the biggest force in investing is not picking the perfect stock — it is staying invested, reinvesting dividends, and giving compounding decades to work.