
In January 1971, $1,000 was serious money — about two months of the average American wage. If you had put it into the S&P 500 (^GSPC) that month and then done absolutely nothing — no trading, no timing, no panic-selling — here is what would have happened.
That is a total return of 380.6x, or about 11.2% a year for 56 years. The number assumes every dividend was reinvested. It is not a typo — it is what happens when compounding gets half a century to work.
Decade by decade
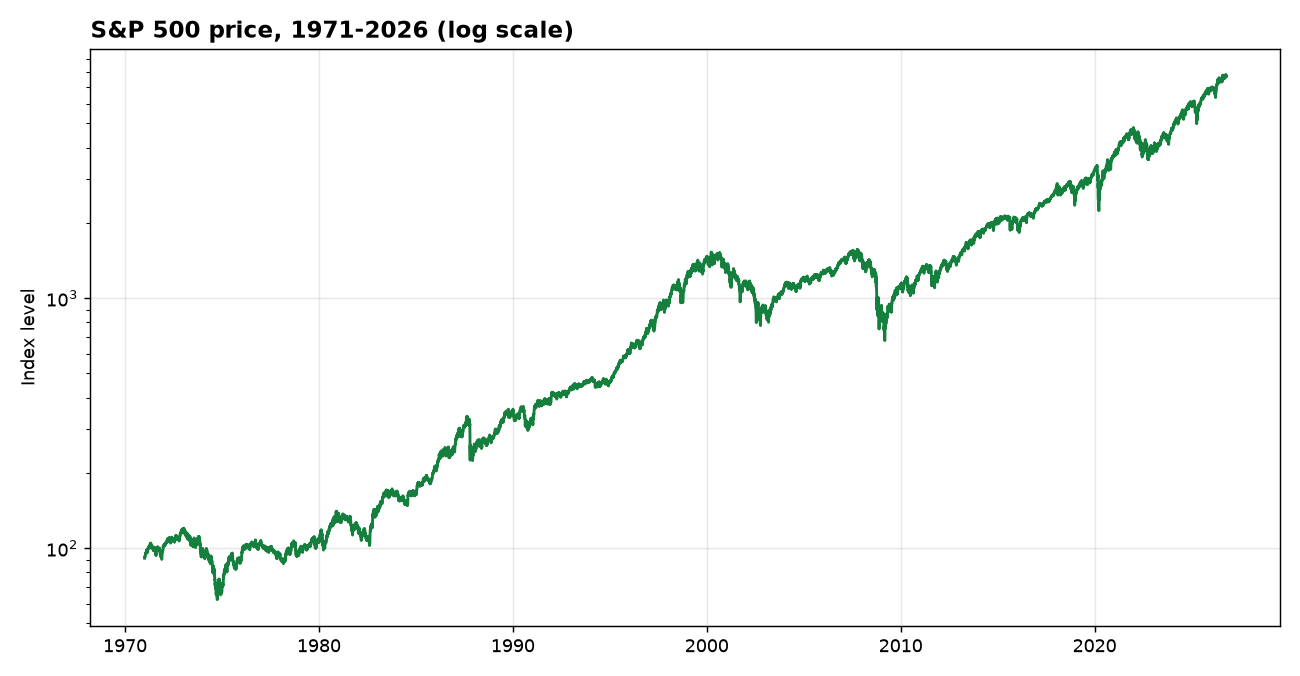
The road to $380,581 was anything but smooth. Here is what $1,000 became at the start of each decade — with dividends reinvested, and on price alone:
| Year | With dividends reinvested | Price only |
|---|---|---|
| 1971 | $1,000 | $1,000 |
| 1980 | $1,716 | $1,148 |
| 1990 | $8,506 | $3,903 |
| 2000 | $45,322 | $15,944 |
| 2010 | $41,190 | $12,101 |
| 2020 | $146,904 | $35,354 |
| Nov 2026 | $380,581 | $83,696 |
The two columns tell different stories. The price column is what a chart shows you. The total-return column is what your account would actually have held. The gap between them is the dividends — the quiet part of the return that never makes headlines.
The best and worst years
Inside those 55 calendar years, the single best year was 1995 (+37.6% total return) and the single worst was 2008 (-37.0%). The worst year is the one that tests whether you actually hold. The best year is the one that rewards you for having held through the worst.
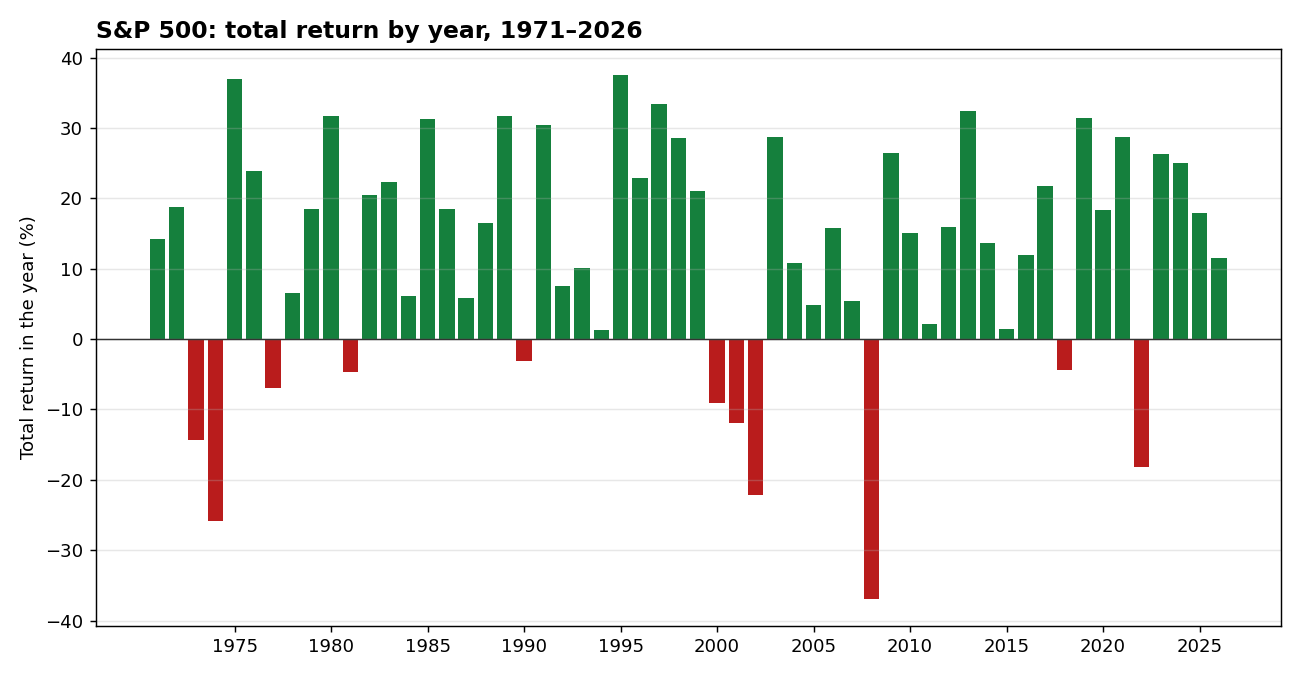
Here is the same story as a picture: every single year from 1971 to 2026, green for up years and red for down years. The red years cluster where you would expect — 1973–74, 2000–02, 2008, 2022 — and the green years outnumber them four to one. The chart is also the reason the best and worst years above are so far apart: single years swing wildly, decades do not.
What this means — and what it does not
This is not a claim that the next 55 years will look like the last 55. It is a measurement of what did happen: a diversified basket of American businesses, held without interruption, compounded at about 11.2% a year. The mechanism was not cleverness. It was time, dividends, and not selling.